
Graph - Supplier returns per week
|
|
The Graph feature for each document type (i.e Supplier returns) in Documents on the Default ribbon, allows you to filter, analyse and view your Supplier returns in a graph using various options to include or exclude in the graph, i.e.:
|

The following two (2) graph reports to analyse your Supplier returns, which are posted, for a specific period, may be printed:
- Graph - Supplier returns per week - Quantities - displays the total quantities of items on the "Quantity shipped" field of Supplier return documents per week in a bar chart.
- Graph - Supplier returns per week - Amount - displays the total amount (exclusive of tax (VAT/GST/Sales tax)) of Supplier return documents per week in a bar chart.
|
|
This graph only includes Supplier returns which are posted. Unposted Supplier returns will be NOT be included in this graph. To view a list of unposted documents, which is not updated to the ledger, go to Input → Checking unposted items (Default ribbon). |

Graph - Supplier returns per week options
To print Graph - Supplier returns per week reports:
- On the Reports ribbon, select User reports → Graphs → Graphs per week → Purchases → Supplier returns per period.
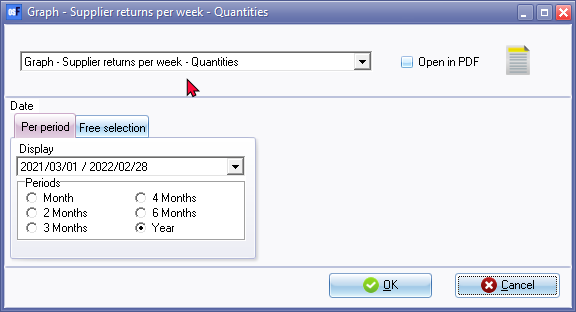
- Select the following:
- Report - Select the Graph - Supplier returns per week - Quantities or Graph - Supplier returns per week - Amount report.
- Period - Select a period on the Per period tab. You may click on the Free selection tab to select a specific date or a range of dates to include in the graph.
- Click on the OK button.
Printed : Graph - Supplier returns per week - Quantities
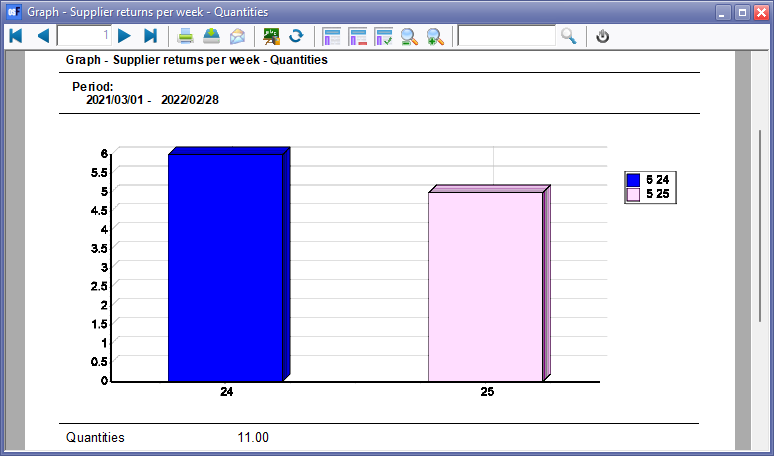
An example of the "Graph - Supplier returns per week - Quantities", is as follows:
The details is as follows:
- Vertical Axis - The total quantities on Supplier return documents per week.
- Horizontal Axis - This is the Number of the Week in the calendar year (1 to 52).
- Totals - Quantities - The total quantities of all Supplier return documents for the selected period.
Printed : Graph - Supplier returns per week - Amount
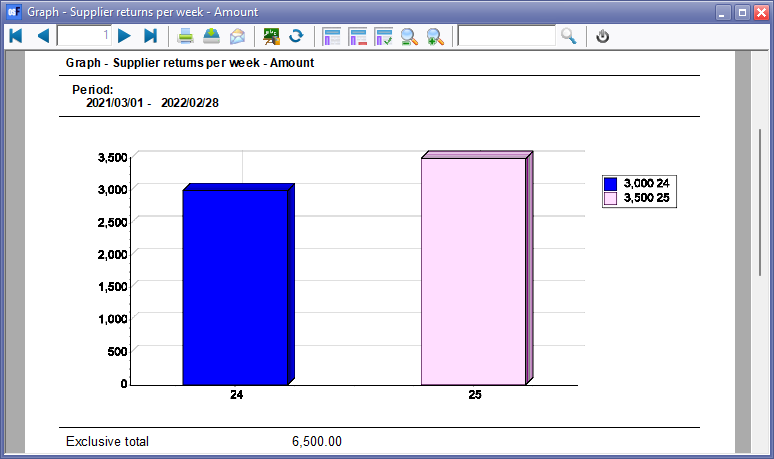
An example of the "Graph - Supplier returns per week - Amount", is as follows:
The details is as follows:
- Vertical Axis - The total amount for Supplier return documents per week.
- Horizontal Axis - This is the Number of the Week in the calendar year (1 to 52).
- Exclusive total - The total amount (exclusive of tax (VAT/GST/Sales tax)) of all Supplier return documents for the selected period.