
Graph - Purchases - (Purchases - Supplier returns) per month
|
|
The Graph feature for each document type (i.e Purchases or Supplier returns) in Documents on the Default ribbon, allows you to filter, analyse and view your Purchases or Supplier returns in a graph using various options to include or exclude in the graph, i.e.:
|

The following two (2) graph reports to analyse your Purchases, which are posted, for a specific period, may be printed:
- Graph - Purchases - Supplier returns per month - Quantities - displays the total quantities of items on the Quantity Shipped field of Purchase documents (Purchases and Supplier returns) per month in a bar chart.
- Graph - Purchases - Supplier returns per month - Amount - displays the total amount (exclusive of tax (VAT/GST/Sales tax)) of Purchase documents (Purchases and Supplier returns) per month in a bar chart.
|
|
This graph only includes Purchase documents which are posted. Unposted Purchase documents (Purchases and Supplier returns) will be NOT be included in this graph. To view a list of unposted documents, which is not updated to the ledger, go to Input → Checking unposted items (Default ribbon). |

Graph - Purchases - Supplier returns per month options
To print Graph - Purchases - Supplier returns per month reports:
- On the Reports ribbon, select User reports → Graphs → Graphs per month → Purchases → Purchases.
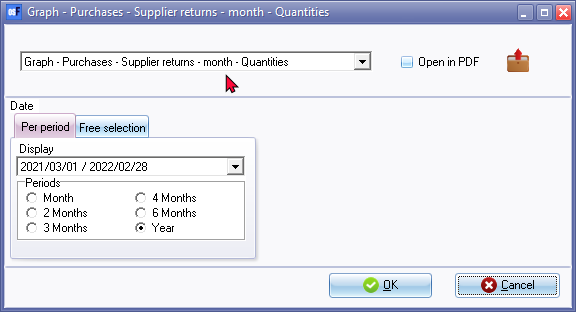
- Select the following:
- Report - Select the Graph - Purchases - Supplier returns per month - Quantities or Graph - Purchases - Supplier returns per month - Amount report.
- Period - Select a period on the Per period tab. You may click on the Free selection tab to select a specific date or a range of dates to include in the graph.
- Click on the OK button.
Printed : Graph - Purchases - Supplier returns per month - Quantities
An example of the "Graph - Purchases - Supplier returns per month - Quantities", is as follows:
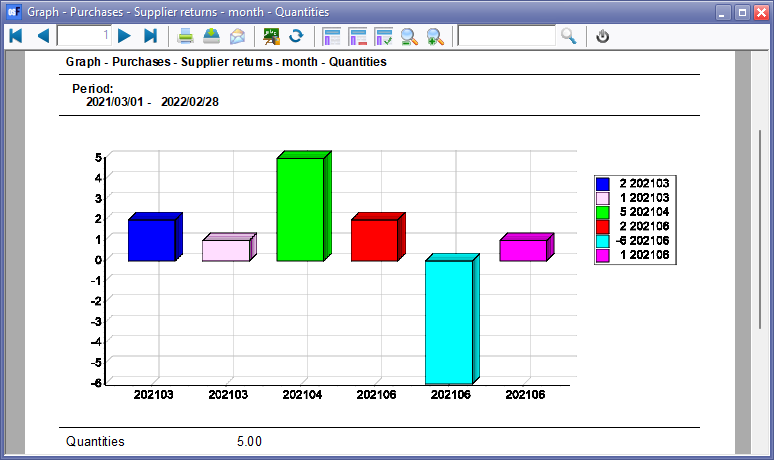
The details is as follows:
- Vertical Axis - The total quantities on Purchase documents (Purchases and Supplier returns) per month.
- Horizontal Axis - This is the Year and Month ("YYYYMM" format) in the calendar year.
- Totals - Quantities - The total quantities of all Purchase documents (Purchases and Supplier returns) for the selected period.
Printed : Graph - Purchases - Supplier returns per month - Amount
An example of the "Graph - Purchases - Supplier returns per month - Amount", is as follows:
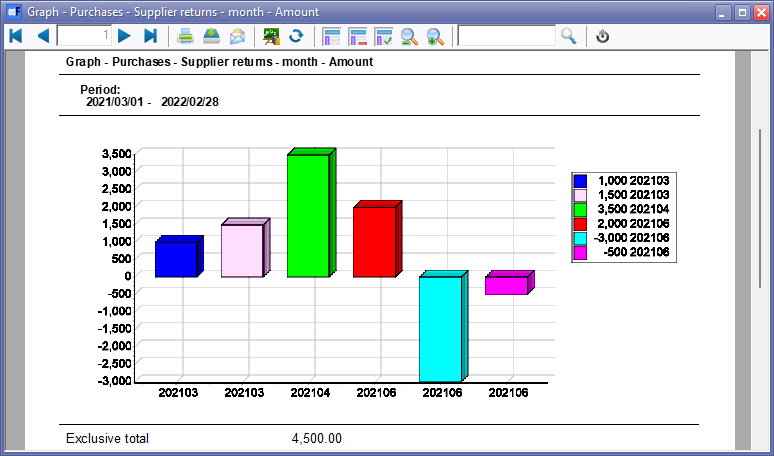
The details is as follows:
- Vertical Axis - The total amount for Purchase documents (Purchases and Supplier returns) per month.
- Horizontal Axis - This is the Year and Month ("YYYYMM" format) in the calendar year.
- Exclusive total - The total amount (exclusive of tax (VAT/GST/Sales tax)) of all Purchase documents (Purchases and Supplier returns) for the selected period.