
Graph - Debtors per week
The Graph - Debtors per week displays the debit and credit transaction totals of all debtor (customer / client) accounts per week in a bar chart.
|
|
This graph only includes batch and document transactions which are posted. Unposted batches and documents will be NOT be included in this graph. To view a list of unposted batches and documents, which is not updated to the ledger, go to Input → Checking unposted items (Default ribbon). |

Graph - Debtors per week options
To print a Graph - Debtors per week:
- On the Reports ribbon, select User reports → Graphs → Graphs per week → Debtors.
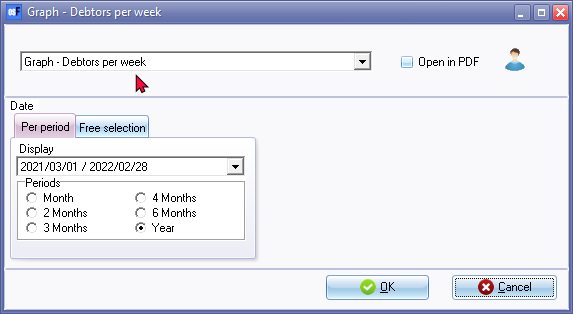
- Select the Period - Select a period on the Per period tab. You may click on the Free selection tab to select a specific date or a range of dates to include in the graph.
- Click on the OK button.
Printed : Graph - Debtors per week
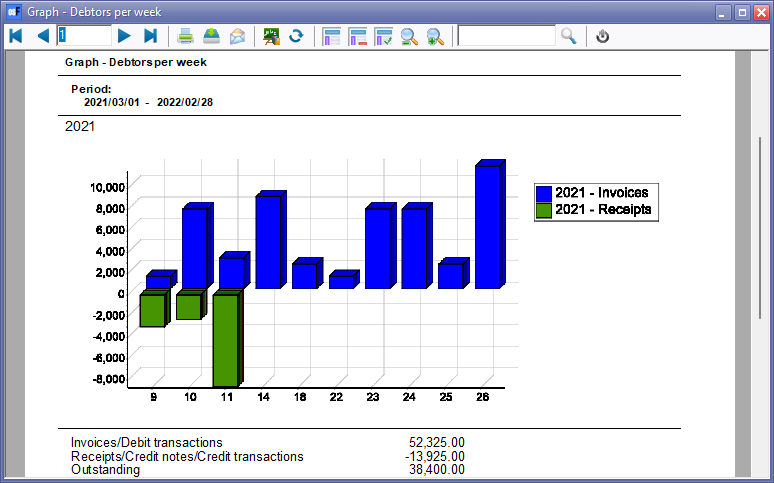
An example of the "Graph - Debtors per week", is as follows:
|
|
The Outstanding amount should balance with the Debtor's control account on all reports, if the same periods are selected. Opening balances will be excluded from this graph. |
The details are as follows:
- Vertical Axis -
- Positive amounts - Invoices and debit batch transactions (e.g. take on opening balances, adjustments, refunds (payments to debtors), Generate multiple transactions (i.e. Interest on overdue debtor accounts, fixed amounts to all debtors and charge amounts), etc. per week.
- Negative amounts - Credit notes, receipts (payments received from debtors) and other credit transactions (e.g. adjustments, bad debts written off, Multiple Transactions (i.e. Balance Debtors with amount less than a specified amount), etc. per week.
- Horizontal Axis - This is the Number of the Week in the calendar year (1 to 52).
- Totals
- Invoices/ Debit Transactions - The total amount value of debit transactions for the entire period.
- Receipts/Credit notes/Credit Transactions - The total amount value of credit transactions for the entire period.
- Outstanding - This is the difference (movement) of the debit and credit transactions. A positive figure indicates that there are more Invoices and debit transactions than credit notes, receipts and credit transactions for the period.