
Drill Down plugin
|
|
Licence : - Manual - Shop - Once-off license - This TC Drill Down plugin enables you to review all your logged data and export it to i.e. MS Excel. |

Introduction to the DrillDown plugin
Want to get to the hart of your data ? Want to be able to create custom reports in Microsoft Excel or LibtrOffice Calc fast?
Then the DrillDown will help you. It has the ability to group, sort and filter all the transactions in a Set of Books with only a view mouse clicks is very powerful. If you have a problem with your data and you have entered some wrong entries you need to now what amount on what account needs to be corrected.
The DrillDown will help you hunt this entry and because of its sophisticated filter and order features does this quicker than any other way. Also will the DrillDown show you the current sales in three screens with each there different approach of displaying data.
Transactions
All the transactions in the Set of Books will be populated in the transactions view
You may filter and sort the views in the powerful grid to build your own custom views of the transactions.
Customers → Invoices → Stock items
Here you can locate your customer and see his invoices. The invoices show the items the items that where both. It has a good a quick navigation interface the helps you hunt down any invoice. The key element here is that you know what client has this invoice.
Stock item → Invoice
See what invoices where used to sell this stock item. Giving you the ability to find an invoice if you now the stock item. Just find that item and if it was sold you will find the invoice with that.
Invoices → Stock item
Here you can find all you invoices and the stock items that were sold on the invoice. It is a fast way of just finding that invoice if the invoice number is what you got.
Chart
And as a last feature we have made a Chart view of your sales documents, including -
- Total sales count : See your total sales in a pie chart with the top of your products as separate pie pieces and the others as one total and find your most selling stock item.
- Total sales amount : See your total sales amount in a pie chart with the top of your products as separate pie pieces and the others as one total and find your biggest sale stock item in amounts.
- Total sales count per day: See your total sales per day in a bar chart And see how certain days affect your sales quantities.
- Total sales amount per day : See your total sales amount per day in a bar chart And see how certain days affect your sales amount. Only sales will be listed for the selected date as well as a total of the sales for the day.
All these views (Except the chart) can be exported to XML HTML EXCEL or TEXTFILE so you can take this even a step higher if you want to.
License
This program is licensed under a commercial license. An error screen will be displayed when this Plugin is launched and will pop up with regular intervals.
This Plugin is already included in the osFinancials releases.
Commercial: Once-off payment
Order: DrillDown
Using the DrillDown
To use this option, you need to open a Set of Books. When the DrillDown is launched, it will by default list all the transactions in the database of the active (opened) Set of Books.
To launch the TC Drill Down:
- On the Setup ribbon. select Plugins → Financial tools → DrillDown.

|
|
Optional - You may select to "Show on ribbon" option to add the TC Drill Down icon to the Default ribbon. This will only be added for the active (opened) Set of Books.
|


- Click on the View data button to launch the TC Drill Down (Transactions).
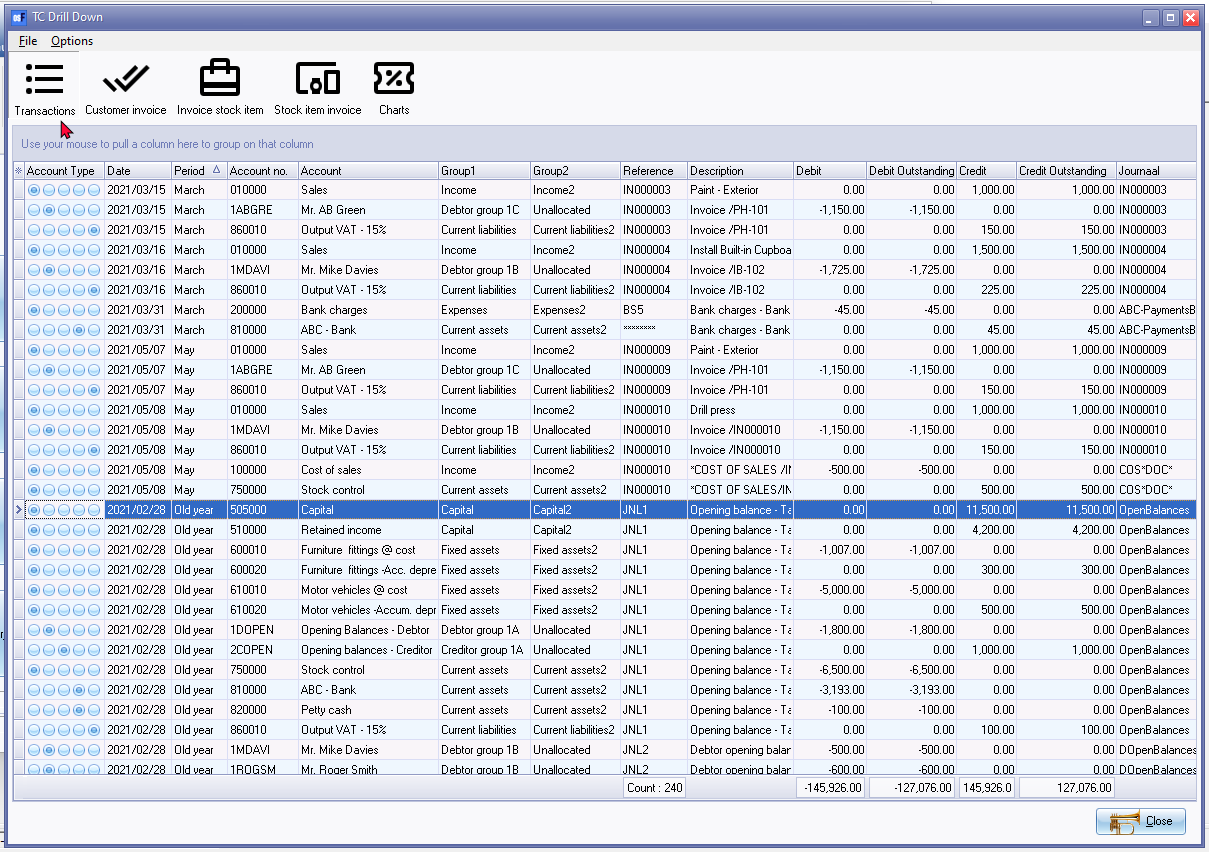
- You may use various options to sort and / or filter your data.
- For example, if you need to check your sales for a specific date, select the date in the date column, and the sales in the account column.
Transactions
The default view when TC Drill Down is launched, is Transactions.
You may customise and use filter options to meet your specific requirements.
Only the data and the sequence in which data columns, and filters will be includes in the exported files.
Show / hide / move columns
By default, all columns, except the "Transaction no., Batch no., Debit tax" and "Credit tax" columns) is not available.
You may add these manually by selecting those columns. You may select only those columns you need to see.
|
Visible columns (Options menu) |
Default |
Sorted (selected) - Alphabetical list |
|
|
|
|

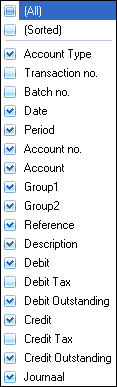

Hidden columns will not be included in an export files.
The columns, is as follows:
- Account Type - There are five (5) account types (i.e. Bank, Creditor, Debtor, General ledger and Tax).
- Transaction no. - The number of the Transaction in the Transaction table of the database.
- Batch no. - This is the number of the batch (journal) as allocated by osFinancials. The last column (i.e. “Journaal”) displays a more friendly version of the Batch no.
- Date - The date of the transaction.
- Period – The accounting period (e.g. Month) of the transaction. "Old year" is the previous financial year.
- Account no. - The account code for Bank, Creditor, Debtor, General Ledger and Tax accounts.
- Account - The description or account name.
- Group 1 - Account group 1 for Bank, General Ledger and Tax accounts. Creditor Group 1 for Creditor accounts and Debtor Group 1 for Debtor accounts.
- Group 2 - Account group 1 for Bank, General Ledger and Tax accounts. Creditor group 1 for Creditor accounts and Debtor group 1 for Debtor accounts.
- Reference - The reference as entered in the Reference column of batches and in the case of sales documents (i.e. Invoices, Point-of-Sales Invoices and Credit notes) and purchase documents (i.e. Purchases and Supplier returns), the document number will be displayed.
- Description - The description as entered in the Description column of batches. In the case of documents, the description is as follows:
- Sales account - Stock Item's description.
- Cost of Sales and Stock Control account - COST OF SALES/Document number.
- Creditor account - Document type/Document number.
- Debtor account - Document type/Document number.
- Tax (Input and Output Tax) – Document Type/Document number.
- Debit - Amounts entered or generated as balancing entries in the Debit column of batches. In the case of documents, the description is as follows:
- Debit tax - Amounts entered or generated as balancing entries in the Debit column of batches. In the case of documents, the description is as follows:
- Debit Outstanding - Outstanding amounts in the Debit column. This is usually the same, as the Debit amount, unless a credit transaction have been linked to the debit transaction to an Open Item account.
- Credit - Amounts entered or generated as balancing entries in the Credit column of batches. In the case of documents, the description is as follows:
- Credit tax - Amounts entered or generated as balancing entries in the Debit column of batches. In the case of documents, the description is as follows:
- Credit Outstanding - Outstanding amounts in the Credit column. This is usually the same, as the Credit amount, unless a debit transaction have been linked to the credit transaction to an Open item account.
- Journaal - This is the Alias (Batch name). If the "Change alias" option on batches were used before posting batches, the Alias will be displayed. Should the aliases of batches not be used, more than one batch (with the same name) will be listed. You may then need to use the Batch no. to filter for a specific batch. In the case of documents, the Document no. will be displayed.
Move column headings
You may change the sequence in which the data in the columns is displayed.

Group / Ungroup columns
Select a column and click on it. While holding the mouse button down, drag it to the column header bar "Use your mouse to pull a column here to group on that column". Select any other column to drag and drop it on column header bar. You may select as many columns, as necessary, to group your data.
You may also drag and drop these columns to the right or left to change the grouping of these columns.

Remove grouped columns
To remove a column from column header bar "Use your mouse to pull a column here to group on that column", you may use the following two (2) options:
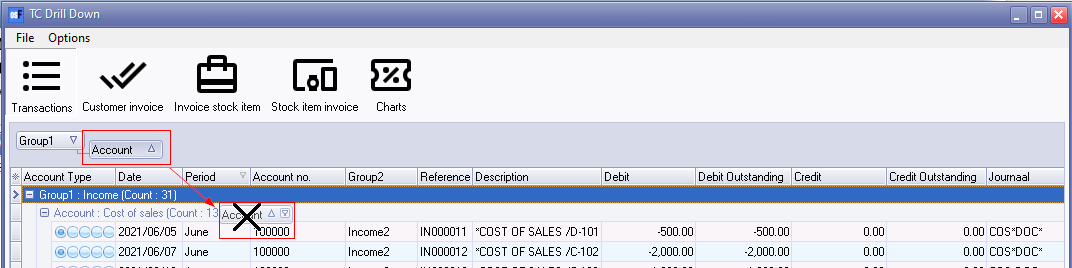
- Select the column heading (e.g., “Account”) on column header bar "Use your mouse to pull a column here to group on that column", and drag it to the first line (above the column headings). When the mouse pointer change to a big X, drop it. The column will automatically be placed in the correct default sequence (or the place of the previous grid layout).
- If you wish to change the column to a specific place, select the column heading (e.g., “Account”) on column header bar "Use your mouse to pull a column here to group on that column", and drag it to the second line (column headings). When you drop it, the column will be added to the selected position or sequence of the columns.
Sort sequences
All the data is, by default, displayed ascending; from the smallest to the highest value (e.g. a-z or 0-9) according to the Period (e.g. April, February, March, etc.).
To change the sort order from ascending (e.g. a-z or 0-9) to descending  (e.g. z-a or 9-0) select a column which you need to sort) and click on it. If you click on the same column again, it will change back to
  ascending sequence.
Filter options in column headings
While viewing and analysing the data you may sort and filter the data, in each column of the active or loaded table. To do this, select the column and click on the  filter icon. A list displaying the data, as well as an "All" option and a "(Custom...)" option in the selected column will be displayed.
For example, the "Account" column, is selected, a list of all Accounts will be displayed.
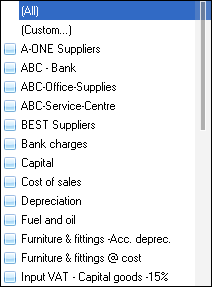
You may select those account you wish to list. Only the transactions for the selected account(s) will be listed.
To adjust a filter in a column, select the "(Custom...)" option in the selected column. The "Adjust filter" will be displayed:

The options to use further criteria to filter the data, is as follows:
- Equal to - list or display all values which is the same as the specified value.
- Not equal to - list or display all values which is not the same as the specified value.
- Less than - list or display all values smaller than the specified value.
- Less than or equal to - list or display all values smaller or equal to the specified value.
- Greater than - list or display all values greater than the specified value.
- Greater than or equal to - list or display all values greater or equal to the specified value.
- Like - list all values in the table similar to the specified value.
- Not like - list all values in the table not similar to the specified value.
- Is null - excludes any value entered, will not be listed or displayed.
- Is not null - is not zero - any value which is not equal to zero will be listed or displayed.
Working with custom filters
Once you have selected an option on a list, the your selection will be displayed at the bottom section of the TC Drill Down screen as follows:

The selected filters will be listed. You may select any filters for quick access to previous filter options. You may click on the Customize button to:
- Make a filter (add or delete conditions and groups).
- Save a filter.
- Open a filter.

To make a filter:
- Select a column and click on the Filter button (or on the … button) and select one of the following options on the Context menu:
- New Condition
- New Group
- Delete row (If you click on the Filter button, you may delete all rows (conditions and groups).
- Select the or option to set a filter value. The following options are available:
- New Condition
- New Group
- Once you have created your conditions or groups, click on the Apply button.
- Click on the OK button to close and exit this Make filter screen.
To save a custom filter file:
- Once you have sorted or filtered your data with the Make filter utility, click on the Save as.. button. The Save active filter as screen will be displayed.
- Select a Directory in which you wish to save the custom filter file.
- Enter a file name.
- Click on the Save button to save the Filter in a (*.flt) Filter File format. You may then at any later stage open the saved *.flt file.
To open a saved a custom filter file:
- Once you have sorted or filtered your data with the Make filter utility, click on the Open... button. The Open saved filter as screen will be displayed.
- Select a Directory in which you have saved the custom filter file.
- Select a valid filter file.
- Click on the Open button. The selected filter file's name will be displayed in the titlebar of the make filter screen.
Customers → Invoices
Here you can locate your customer and see his invoices. The invoices show the items the items that where both. It has a good a quick navigation interface the helps you hunt down any invoice. The key element here is that you know what client has this invoice.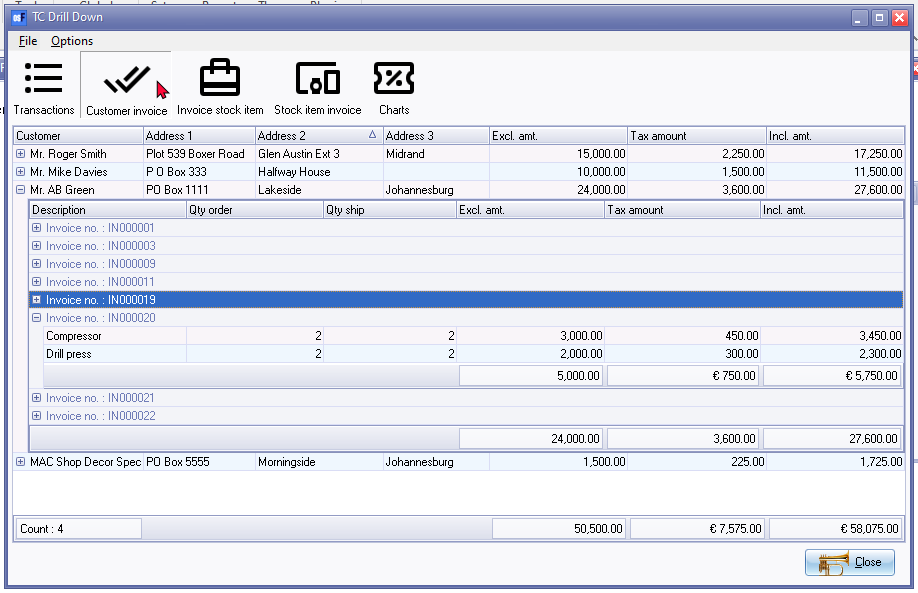
Stock item → Invoice
See what invoices where used to sell this stock item. Giving you the ability to find an invoice if you now the stock item. Just find that item and if it was sold you will find the invoice with that.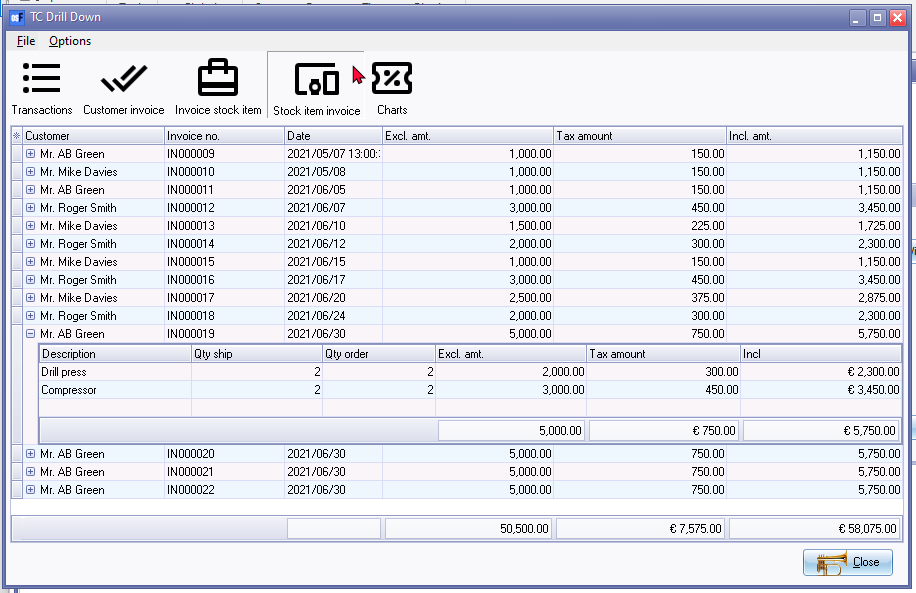
Invoices → Stock item
Here you can find all you invoices and the stock items that were sold on the invoice. It is a fast way of just finding that invoice if the invoice number is what you got.

Chart
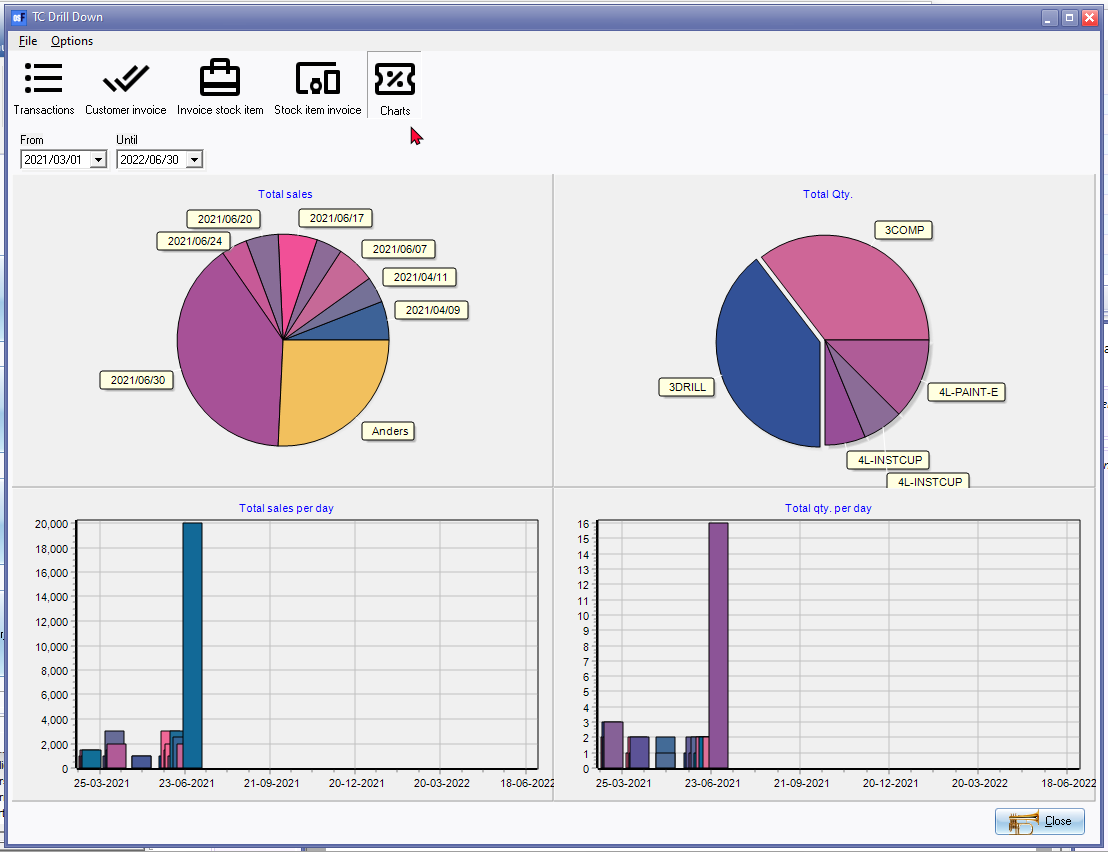
And as a last feature we have made a Chart view of your sales documents, including -
- Total sales count : See your total sales in a pie chart with the top of your products as separate pie pieces and the others as one total and find your most selling stock item.
- Total sales amount : See your total sales amount in a pie chart with the top of your products as separate pie pieces and the others as one total and find your biggest sale stock item in amounts.
- Total sales count per day: See your total sales per day in a bar chart And see how certain days affect your sales quantities.
- Total sales amount per day : See your total sales amount per day in a bar chart And see how certain days affect your sales amount. Only sales will be listed for the selected date as well as a total of the sales for the day.
Export the Data
Once you have sorted and filtered your criteria, you may Export the data in exactly the same sequence as displayed in the TC Drill Down screen.
- Once you have sorted or filtered your data, click on the File → Export menu.
- The Save as screen will be displayed.
- Select a Directory in which you wish to export the selected data.
- Enter a file name.
- Select one of the following file formats:
- XML - Extensible Mark-up Language
- HTML - HyperText Mark-up Language
- Excel - Microsoft Excel Spreadsheet
- Text - Text file
- Click on the Save button. Once you have exported the data, you may locate the file and open it in your systems default program for the saved file type. For example, you may use it to build graphs in or Microsoft Excel, LibreOffice Calc spreadsheets, and make powerful presentations of your data in or Microsoft PowerPoint or LibreOffice Impress.
Spreadsheets
The following is an examples of exported data in Microsoft Excel spreadsheet with charts for expenses exported using the TC Drill Down. The exported data can be easily used to build custom pivot tables and charts.
